Every employer running an OSHA 1910.95 compliant audiometric testing program is accumulating a dataset that most EHS programs read only for compliance: which workers have had their annual audiogram, which haven't, and which have a Standard Threshold Shift requiring follow-up. According to CDC/NIOSH, approximately 13% of noise-exposed tested workers have material hearing impairment. That statistic is not just a public health figure — it is an approximation of the safety risk concentration sitting in your audiometric records right now.
Soundtrace gives EHS directors real-time visibility into facility-level hearing threshold distributions — turning compliance audiograms into actionable safety risk intelligence with automated STS detection and licensed audiologist review.
- The audiometric database as a safety intelligence asset
- Understanding the hearing threshold distribution
- What the facility-level analysis looks like
- Connecting audiometric data to fall prevention programs
- Why this analysis requires complete, per-worker records
- The forward-looking frame: HCP as injury prevention
 Audiometric records contain safety risk intelligence beyond compliance — when the data infrastructure supports analysis.
The Audiometric Database as a Safety Intelligence Asset
The research linking hearing loss to fall and injury risk is now well-established. Mild hearing loss is associated with a three-fold increase in fall odds. A 2025 systematic review and meta-analysis covering more than 5 million participants found hearing loss associated with 51% greater odds of falls compared to normal hearing. NIOSH directly states that workers with hearing loss are more likely to be injured on the job.
What that research makes possible — but what almost no occupational safety program currently does — is to use the audiometric database already required by OSHA as a forward-looking safety risk signal. The question is not just "which workers have an STS requiring notification?" It is: "What does the current threshold distribution of our workforce tell us about our aggregate fall and injury risk exposure?"
The answer to that question is sitting in your audiometric records. Whether you can read it depends on whether those records are complete, current, and accessible in a format that allows analysis.
Understanding the Hearing Threshold Distribution
The NIOSH Occupational Hearing Loss Surveillance Project uses WHO/Global Burden of Disease audiometric definitions to categorize hearing status. These are the same categories relevant to fall and injury risk stratification:
| Category | Better-Ear Average (dB HL) | NIOSH Prevalence (noise-exposed workers) | Fall/Injury Risk Implication |
|---|---|---|---|
| Normal hearing | <26 dB HL | ~87% of tested workers | Reference risk level |
| Slight impairment | 26–40 dB HL | ~9% of tested workers | ~3× fall odds (Lin & Ferrucci); elevated injury risk |
| Moderate impairment | 41–60 dB HL | ~3% of tested workers | Substantially elevated; difficulty understanding safety communications in noise |
| Moderately severe | 61–80 dB HL | ~1% of tested workers | Highest fall-to-hospitalization risk (Girard et al. 2015) |
| Severe/profound | >80 dB HL | <1% of tested workers | Severe; OR 1.97 for hospitalized falls in occupational cohort |
These are population averages. At the facility level, the distribution can be dramatically different depending on workforce age, industry, years of noise exposure, and program effectiveness. A facility in primary metals or paper manufacturing that has been operating for 40 years without rigorous hearing conservation may have 20–25% of its senior workforce at mild impairment or above. A facility with a strong program, pre-employment audiometric baselines, and consistent STS follow-up may have 7–8%.
That difference — 7% vs. 23% at mild impairment or above — is a measurable, quantifiable safety risk differential. In a workforce of 300 enrolled workers, it is the difference between approximately 21 workers and approximately 69 workers operating with elevated fall risk on the production floor every day.
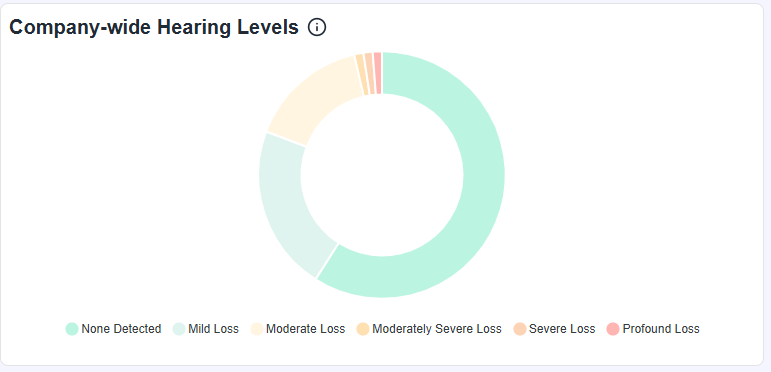
Soundtrace automatically computes your facility-level hearing threshold distribution from every audiogram in your program. The Company-Wide Hearing Levels chart shows the proportion of your enrolled workforce across each impairment category in real time.
What the Facility-Level Analysis Looks Like
A facility-level audiometric profile answers these questions from your existing audiometric data:
1. Current Impairment Distribution
What percentage of currently enrolled workers fall into each hearing category? Which job classifications have the highest concentration of workers at mild impairment or above? How has the distribution changed over the past 3 years — is the impairment rate improving, stable, or worsening?
2. STS Trajectory Analysis
Which workers have had confirmed STSs in the past 24 months? Of those, how many have a cumulative threshold profile that now places them at mild impairment or above — even if their most recent STS was addressed in isolation? A worker who had a borderline STS three years ago and another two years ago may have accumulated to mild impairment without any single event triggering a severity review.
3. New-Hire Baseline Distribution
What percentage of workers are entering at hire with pre-existing hearing impairment? This matters for two reasons: it establishes WC baseline documentation, and it immediately identifies new workers who present with elevated fall/injury risk from their first day on the floor. A new hire in a high-noise job classification presenting with 30 dB HL average thresholds at hire is already at approximately three times the fall risk of a new hire with normal hearing — before any occupational noise exposure at your facility.
4. Impairment Rate by Location and Department
For multi-facility employers, comparing the impairment rate across locations identifies which facilities have a higher proportion of workers at elevated fall/injury risk and which may have less effective hearing conservation programs. Department-level analysis can identify whether specific production areas are generating progressive hearing loss at higher rates, signaling either noise control failures or HPD compliance gaps.
Connecting Audiometric Data to Fall Prevention Programs
OSHA's 1910.95 audiometric requirement was designed to protect hearing. The fall/injury risk implication of hearing loss means that the same program — done well, with complete records and accessible data — also informs fall prevention. The connection points are practical:
- Fall prevention program targeting: Workers identified at mild impairment or above are elevated-risk candidates for fall-specific safety training, slip-resistant footwear programs, and enhanced hazard awareness protocols. This targeting is evidence-based rather than arbitrary.
- Job placement and task assignment: A worker with confirmed mild hearing impairment working near reversing equipment, at elevation, or in an area with heavy warning-signal dependence warrants heightened awareness. This is not a disability accommodation issue — it is industrial hygiene applied to the known mechanisms of hearing-related fall risk.
- STS follow-up as a safety trigger: The current OSHA STS follow-up process focuses on HPD refitting and notification. Adding a safety risk component — flagging the worker to the floor supervisor and safety team as having a newly elevated fall/injury risk profile — extends the value of the audiometric program beyond hearing conservation into general safety management.
Why This Analysis Requires Complete, Per-Worker Records
The facility-level audiometric analysis described above requires three conditions that are not universally met:
Complete enrollment: Analysis is only representative of the actual workforce if all noise-exposed workers are enrolled and tested consistently. Gaps in enrollment — missed shifts, mobile van scheduling failures, workers hired between testing cycles — reduce both the compliance value and the safety intelligence value of the program.
Current audiograms for all workers: A distribution built from audiograms that are 18–36 months old for a significant portion of the workforce reflects the workforce's hearing status from 18–36 months ago, not today. Current per-worker annual audiograms are the minimum data currency for reliable risk analysis.
Accessible, employer-controlled records: Audiometric records held by a mobile van vendor in a proprietary system are not accessible for the kind of aggregate analysis described here. Employer-controlled cloud records with query-able data structure are what enable the facility-level analysis that turns the compliance record into a safety intelligence tool.
Soundtrace's platform stores every audiogram in employer-controlled cloud records supervised by a licensed audiologist, with per-worker threshold history accessible at any time. That record structure is the foundation for converting your audiometric database from a compliance file into a safety risk dashboard. See also: Hearing Loss and Workplace Fall Risk: What Your Audiometric Data Is Telling You.
The Forward-Looking Frame: HCP as Injury Prevention
The conventional frame for hearing conservation programs is backward-looking: document what happened to workers' hearing, defend against WC claims, avoid OSHA citations. The evidence-base on hearing loss and fall/injury risk enables a genuinely forward-looking frame: the hearing conservation program that maintains more workers at normal thresholds — through early STS detection, effective HPD programs, and noise controls — is producing a measurable reduction in the proportion of the workforce at elevated fall and injury risk.
That reframe changes the ROI calculation for hearing conservation program investment. The avoided NIHL WC claim is one component. The avoided fall injury — with its potential for fracture, TBI, extended lost-time, and high-severity WC claim — may be a larger one. See: The Hidden WC Connection: How Hearing Loss Drives Non-Hearing Injury Claims.
- 29 CFR 1910.95 — OSHA Occupational Noise Exposure Standard
- CDC/NIOSH: About Occupational Hearing Loss
- NIOSH Occupational Hearing Loss Surveillance: Overall Statistics
- Hearing Loss and Falls Among Older Adults in the United States — PMC/NIOSH
- Hearing Loss and Falls: Systematic Review and Meta-Analysis (2025) — PMC
- Hearing Impairment Among Noise-Exposed Workers, 2003–2012 — CDC MMWR
- Girard et al. (2015): Occupational Noise and Work-Related Injuries Leading to Hospitalization — Injury Prevention
Hearing conservation is your strongest injury prevention investment
Understand the full business case — compliance, WC defense, and fall injury risk reduction — in our complete guide.
See the Full ROI Case → Get a Free Quote- Hearing Loss and Workplace Fall Risk: What Your Audiometric Data Reveals
- Audiometric Testing for Employers: Complete OSHA Guide
- Pre-Employment Audiogram: Workers Compensation Defense Guide
- Hearing Loss and Workplace Accidents: The Safety-Critical Link
- The Business Case for Hearing Conservation: ROI Beyond OSHA Compliance